Abstract
This ML model allows us comprehend how economic variables, weather, holidays, time of year, industry trends, significant events, our distribution, our investments, and our price relate to the impact and sales. The model learns from signals for each of these factors and attribute specific revenue impacts to that specific signal. In order to conduct optimization scenarios and determine the most optimal allocation of our budget for each wholesaler, brand, investment vehicle, and week, the model establishes a relationship (in the form of saturation curve) between revenue and investments, thereby allowing us to estimate revenue uplift/incremental ROI for each additional dollar of investment.
Problem Statement
We need to develop a ML Model that learns to forecast the impact of future investments and assess the impact of price, distribution, and various investments made by ABI on their numerous brands and wholesalers in USA. Further, based on the relationships learned by ML model, we need to run optimization on the saturation curves predicted by the model to allocate budgets effectively.
Solution
ML Model
The machine learning algorithm gains an understanding of how our impacts are broken down by various effects and investment vehicles. When we invest $1,000 on a given vehicle, the sales we receive are not just generated from the $1,000 investment we made but rather also from different effects that took place, like holiday, weather, promotions, inflation, distribution, etc. We can determine the amount of incremental impact that spending on the particular investment vehicle caused if we can split our impacts into these different factors. This helps in determining whether the investment vehicle is worthwhile and how much money is recommended to be invested in it. We learn 2 things the ROI curves and the Historical Decomposition of various investments.
Historical Decomposition
Historical decomposition is the primary artifact produced by the model. Therefore historical decomposition is rather the output which informs how sales generated over time is broken down into impacts. One factor that affects how we drink and use ABI goods is the temperature. Sales might be positively impacted by rising temperatures. Rising inflation in a region, might contribute to a negative impact on sales. Let's say if we did not make any investments and didn't have any significant uncontrollable effects happening, we would still be able to sell products without any of this, this is our baseline where these effects gets applied on. The remaining is the incremental impact that investments and any significant effects made!
This helps us understand why the products sold and how much of an impact does spending on a particular investment vehicle gives us? This gives us the decomposition of sales over time and helps us to forecast and later generate the ROI curves for each vehicle to find the model optimal investments.
ROI Curves
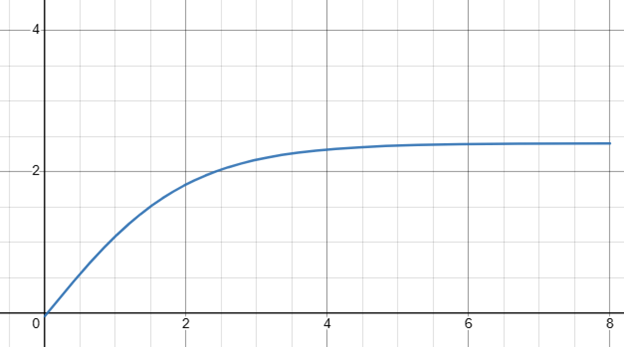
As part of learning the historical decomposition, the ROI curves are produced. These graphs constitute of 2 axis, the x axis which represents the spend values. The y axis is the incremental impact on revenue (or volume) that spending that amount would drive. This is a saturating curve that models diminishing returns. From this curve we can see that the investment vehicle steadily gives less returns on each dollar and we need to invest in the more profitable range. The ROI curves are generated for a wholesaler, brand, and investment vehicle combination, and they will have different rates of saturation. These ROI curves are further used for optimization to find the predicted optimal allocation. Note that these curves are concave in nature (which just means has diminishing returns). They also model how spends at different times can have more or less impact, but this modelling does not change their shape, rather just scaling the impact the same for all spend points (though by a different factor for each curve).

P&L Optimization
The ROI curves are used as inputs here, the user provides the marketing vehicles we will be using to invest, and the brands that will make use of this marketing budget, the user level constraints like contracts which suggests the min and max allowed amounts for different brand, vehicle time combinations and the maximum available budget. We take all of these inputs and perform convex optimization to find the optimal allocation of our marketing budget to different brands, wholesalers, marketing vehicles, and time in order to get the optimal(highest) ROI. Since the curves are concave in nature and the allowable constraints are convex, it is mathematically assured that there is exactly one single optimal allocation for the given scenario.